
Before signing a compromise, we often open Google Maps in satellite view to check the orientation of a plot of land. North is at the top, south is at the bottom, and we get a first idea.
The problem is that this static view does not indicate the actual path of the sun throughout the day or the shadows cast by neighboring buildings or trees. To go further, one must cross-reference Google’s mapping data with solar simulation tools that model the sun’s trajectory hour by hour.
You may also like : How to Change the Name on an SNCF Train Ticket: Practical Guide and Tips
Limitations of Google Maps Alone for Assessing Sunlight on a Plot
Google Maps provides precise GPS coordinates and a usable satellite view. You can read the approximate azimuth of a facade, identify the presence of a building to the south, or spot rows of trees likely to create shade. It’s a good starting point.
However, the platform does not model the height of the sun according to the season. A south-facing balcony may receive direct sunlight in summer at noon but find itself in the shadow of a neighboring building as early as November, when the sun remains low on the horizon. Google Maps does not show this dynamic reality.
See also : Where to Find the Battery on Renault Austral: A Guide to Locating and Maintaining Your Battery
This is where the solar trajectory simulation on Google Maps comes into play, complementing third-party tools that utilize the same mapping data while adding a layer of solar calculation.
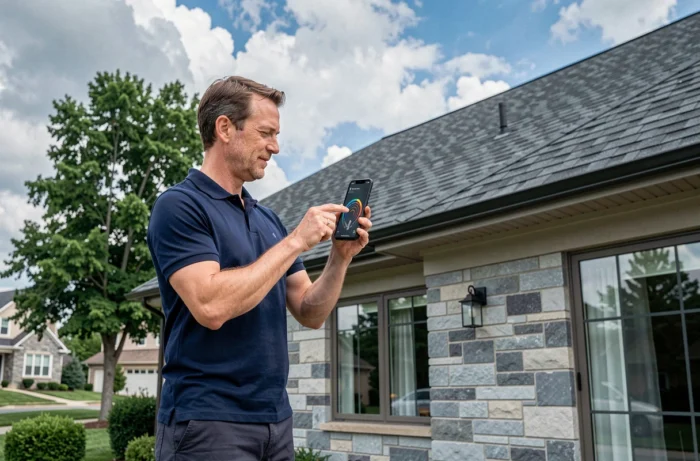
Solar Simulation Tools Compatible with Google Maps: Which to Use
Several applications overlay the sun’s trajectory on a Google Maps background or directly utilize the platform’s data. No technical skills are needed to use them, but not all offer the same level of accuracy.
SunEarthTools and Its Interactive Map
SunEarthTools displays a complete solar diagram for a given point on an interactive map: azimuth, elevation, sunrise and sunset times. You enter an address or coordinates, and the trajectory outline appears overlaid on the map background. The tool also calculates the shadows cast for a specific date and time.
The main advantage is that it is free and accessible without registration. You can quickly compare two addresses by opening two tabs. The downside: the 3D rendering remains rudimentary, and surrounding buildings are not modeled in volume.
Shadowmap and Global 3D Simulation
Shadowmap offers a 3D sunlight simulation that covers most urban areas. The application models buildings, trees, and terrain, then projects shadows in real-time based on the selected date and time. This allows you to precisely visualize shadow areas at every hour of the day on a given plot.
Shadowmap is used by several hundred thousand people each month. The free version is sufficient for occasional real estate assessment.
Google Solar API: Solar Potential Data by Building
Since the transformation of the former Sunroof project, Google offers a Solar API structured around three endpoints (buildingInsights, dataLayers, geoTiff). It provides for each covered building data on roof geometry, shading, and annual and monthly solar potential.
This API covers over 470 million buildings worldwide, including Western Europe. For an individual, direct access to the API remains technical. However, several real estate websites and solar installers integrate this data into their own interfaces, making it usable without development skills.
One point to note: the billing model of Google Maps Platform was reorganized on March 1, 2025, with the removal of the flat monthly credit of $200 in favor of free caps per SKU and the creation of Essentials, Pro, and Enterprise tiers. Free access to solar data now depends on the volume of requests, which mainly affects developers and platforms, not the end user who consults a site integrating this data.
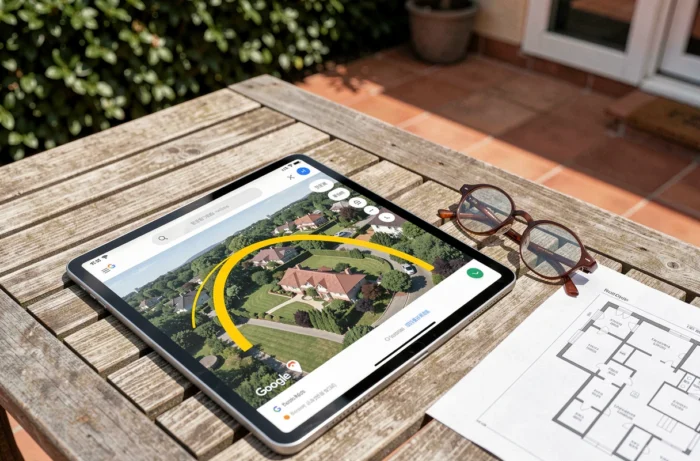
Step-by-Step Method to Simulate the Sun’s Trajectory on a Property
Here is the process we use to assess the actual sunlight exposure of a property before purchase or before installing a solar system.
- Open Google Maps in satellite view and note the exact GPS coordinates of the property (right-click on the point, copy the coordinates).
- Paste these coordinates into SunEarthTools or Shadowmap to display the sun’s trajectory on key dates: summer solstice (June 21), winter solstice (December 21), and equinoxes (March and September).
- On Shadowmap, activate the 3D view and scroll through the hours to identify periods of shadow cast by neighboring structures or vegetation.
- Compare with data from Google’s Solar API (via a site that integrates it) to verify the estimated solar potential of the roof, particularly the slope and azimuth of the facets.
- Cross-reference these results with a site visit, ideally in winter when shadows are longest and most revealing.
The digital simulation remains a decision-support tool. Feedback varies depending on the quality of the available 3D model for the area in question: in dense city centers, modeling is often reliable, while in rural or suburban areas, some obstacles (tall hedges, recent sheds) may be missing.
Sunlight and Solar Energy: What Simulation Changes Concretely
For a solar panel project, simulation allows estimating the number of hours of direct exposure per roof facet, month by month. Without this data, sizing is done blindly. With it, one can decide whether to install on the south slope (maximum yield in winter) or distribute across two slopes to smooth production throughout the day.
For a real estate purchase, simulation reveals elements that are invisible during a standard visit: a terrace that loses sunlight after 3 PM in December, a living room that never receives direct light in winter, or conversely, a west-facing facade that overheats in summer and poses a thermal comfort issue.
The tool does not replace a sunlight assessment conducted by a study office, but it helps filter properties or validate a field intuition before incurring expenses. When we overlay the sun’s trajectory on the satellite map of a property, we move from a subjective estimate to an exploitable geographical data.